Posts

Showing posts with the label IronPython

Spotfire: How to add Gaussian Curve Fit to a chart using C# or IronPython code

Image
 Here is a Spotfire ScatterPlot with a Gaussian Curve.  It is straightforward to add it from the UI by right clicking on the chart, opening up properties dialog and adding a Gaussian Curve Fir from the Lines & Curves section: Here is how you would add it from the code:  var gaussianFittingModel = scatterPlot.FittingModels.AddNew<GaussianFittingModel>();
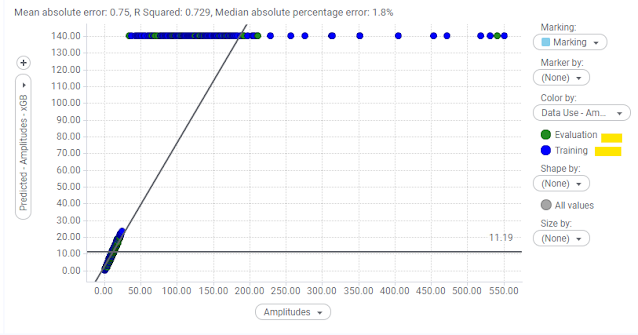
Spotfire ScatterPlot Set Color By Category (C#, IronPython)

Image
                var coloring = scatterPlot.ColorAxis.Coloring;             coloring.Clear();             coloring.DefaultColor = Color.White;             var categoricalColorRule = coloring.AddCategoricalColorRule();             var colorKeys = categoricalColorRule.GetExplicitCategories();             scatterPlot.ColorAxis.Coloring.SetColorForCategory(colorKeys[0], Color.ForestGreen);             scatterPlot.ColorAxis.Coloring.SetColorForCategory(colorKeys[1], Color.Blue);             scatterPlot.ColorAxis.Coloring.SetColorForCategory(colorKeys[2], Color.Orange);